Business Concepts
How to Monitor Sales Performance in 2026
See how sales leaders use real-time sales monitoring to track sales performance, pipeline, rep activity, and forecast before quota problems hit.
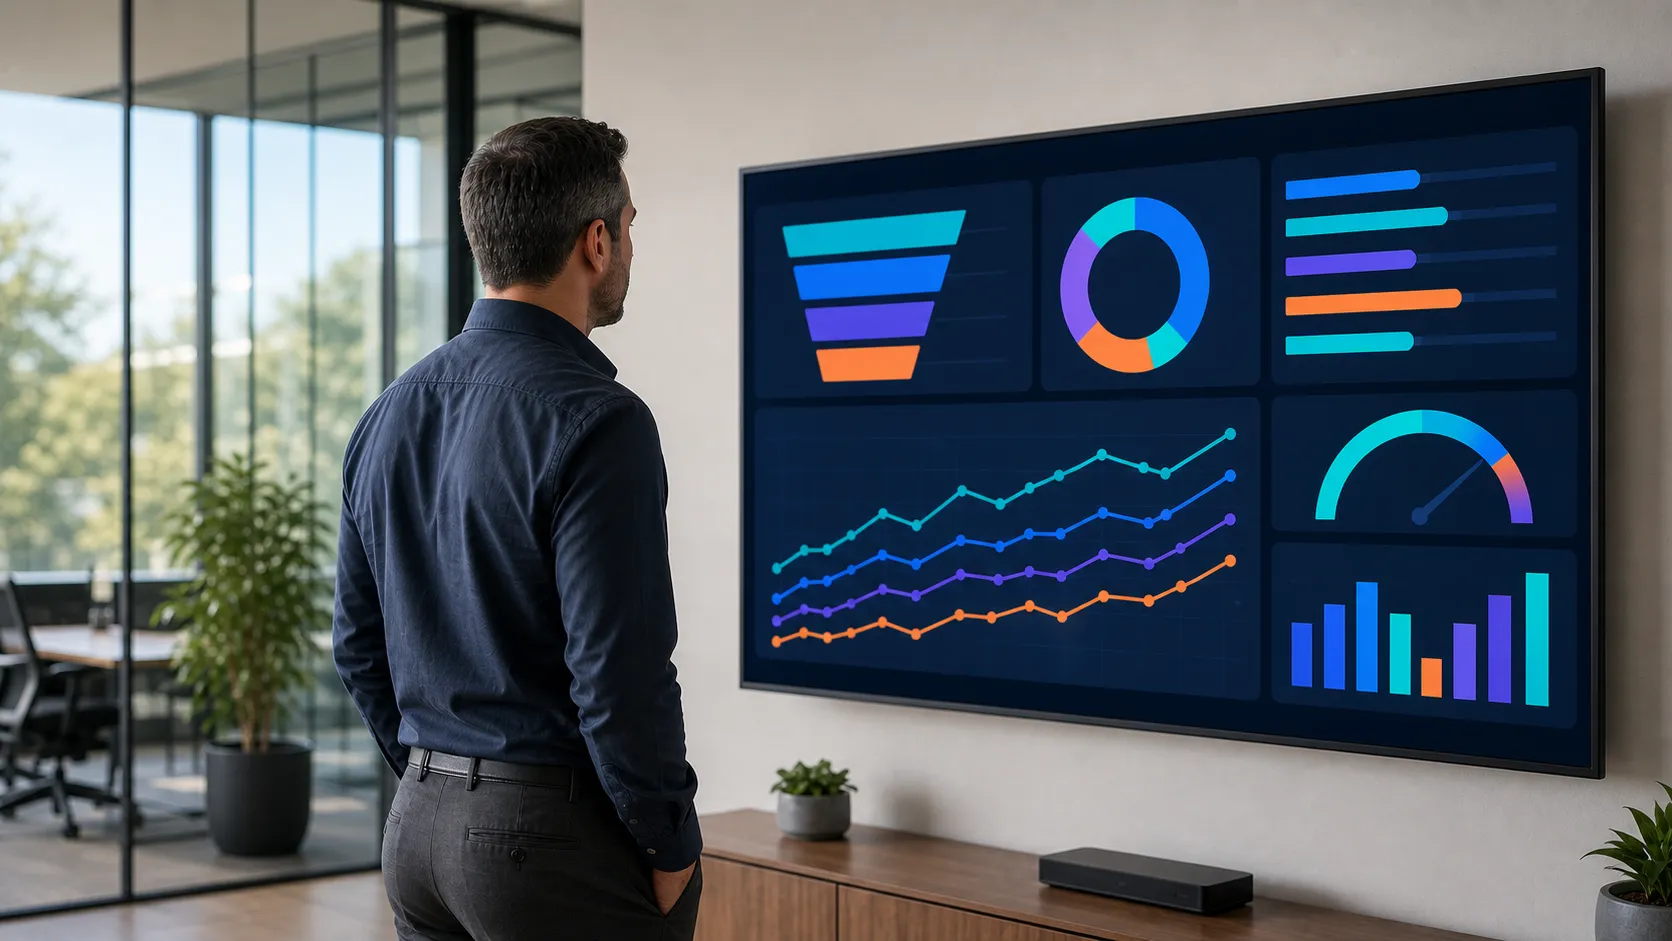
Monitoring sales is the discipline of tracking rep activity, pipeline health, and revenue against quota in real time, instead of at the end of the month. The right metric, tracked weekly, catches problems before the quarter is already lost.
Quick answer
Monitoring sales means tracking sales performance data, rep activity, and pipeline coverage as it happens, using a CRM and dashboard instead of a spreadsheet updated once a month. It turns sales monitoring from a lagging report into a leading indicator you can act on before the quarter ends.
Key takeaways
- Monitoring sales means combining rep activity, pipeline coverage, and quota attainment into one real-time view, not a single end-of-month report.
- A CRM such as Salesforce or HubSpot is the backbone of any sales monitoring system, feeding the sales dashboard leaders check daily.
- The metrics worth tracking include conversion rate, average deal size, sales cycle length, and pipeline coverage ratio, not just closed revenue.
- Weak sales monitoring creates a visibility gap, so leaders react to a missed quota instead of catching the sales trends that caused it.
- Sales performance connects directly to cash flow, accounts receivable, and gross margin, not just the sales team's own scoreboard.
What Is Monitoring Sales?
Monitoring sales is the ongoing practice of tracking sales performance data, such as calls, pipeline stage, and closed revenue, so a sales team and its leaders can see progress before the period ends. It replaces guesswork with a live view of what reps are actually doing.
The term covers both the sales process, what a rep does day to day, and the sales monitoring system built on top of it: the CRM, dashboard, and reports that make that activity visible. Done well, it becomes one of the more practical business concepts a manager applies every week, part of solid sales management rather than a once-a-quarter exercise.
Monitor sales performance closely enough and patterns show up early: a stalled sales pipeline, a rep whose sales activities have quietly dropped, or a sales cycle that keeps stretching. To monitor sales effectively you need activity data, not just outcome data. Miss that visibility and you only find out at quarter close, when it is too late to fix.
Monitoring Sales Explained: From Spreadsheets to Real-Time Dashboards
Most sales organizations start with spreadsheets. A rep updates a deal manually, a manager rolls it up weekly, and by the time anyone sees the number it is already stale.
Performance monitoring changes that by pulling sales data straight from a CRM. Platforms like Salesforce and HubSpot log every call, email, and stage change automatically, so the sales dashboard updates itself instead of waiting on a rep. That is what real-time sales monitoring looks like in practice.
That shift from manual sales reporting to real-time monitoring is the whole point of modern sales tracking. Leaders get performance in real time, not a summary written from memory on a Friday afternoon, and sales revenue this month stops being a mystery tied to effort from months ago.
A sales dashboard nobody checks daily is just a prettier spreadsheet.
Good monitoring tools also connect sales and marketing, so lead generation numbers sit next to pipeline coverage instead of living in a separate report. That gives leaders a full view of performance instead of a single number, and it is what lets a customer relationship management platform earn its subscription cost.
Sales Performance Metrics That Actually Matter
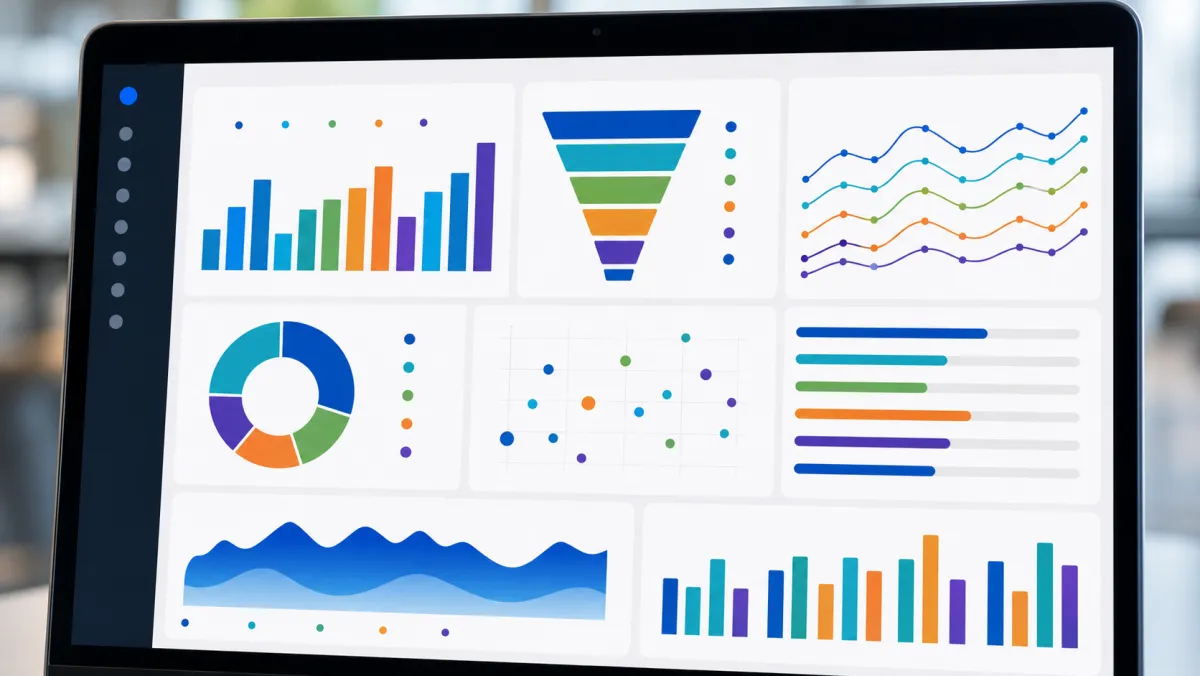
Not every metric deserves a spot on the dashboard. The key performance indicators below are the sales metrics worth tracking, because each one is a leading indicator, not just a scoreboard.
| Metric | What it tells you |
|---|---|
| Quota attainment | Percentage of quota each rep or team has closed for the period. |
| Pipeline coverage ratio | Open pipeline value versus quota; below 3x usually signals a coverage gap. |
| Conversion rate | Share of leads or opportunities that move to the next sales stage. |
| Average deal size | Typical revenue per closed deal, useful for spotting discount creep. |
| Sales cycle length | Average time from first touch to closed deal. |
| Win rate | Closed-won deals divided by total opportunities, by rep and by segment. |
Good performance tracking means watching these sales metrics together, not one at a time. A high conversion rate with a shrinking average deal size still points to a real problem in sales performance metrics, even if overall sales looks fine on paper.
Monitoring individual sales reps matters as much as tracking team performance in aggregate, because overall performance can look fine even when one rep is struggling. Rep performance varies widely on any real team, and analyzing sales data by segment, not just the team total, is how a sales manager spots a rep who needs coaching before the quarter is unrecoverable. That is exactly what leaders track when pipeline coverage disagrees with quota attainment.
Monitoring Sales Examples in the Field
A weekly sales review is the simplest example. A sales manager pulls the dashboard, checks pipeline coverage against sales targets, and flags any rep whose numbers moved the wrong way since last week.
Inside sales teams often monitor sales activities hour by hour: calls dialed, emails sent, meetings booked. A VP of sales watching that layer catches an activity drop days before it shows up in closed revenue.
Sales representatives without that visibility often feel like they are guessing at what matters, a pattern close to the signs you are being set up to fail at work when expectations exist but the data to hit them does not.

How to Apply Monitoring Sales
Building a sales monitoring system does not require new headcount. Consistent monitoring is one of the simplest levers sales professionals have for improving sales performance without hiring anyone new, and it lets a team optimize sales strategies before the quarter ends, not after.
- Set clear sales goals and quotas. Every sales rep needs a specific sales goal and realistic sales quotas tied to the team's overall sales targets, not a vague aspiration.
- Centralize sales data in one CRM. A shared system beats five personal spreadsheets and stops sales data from living in someone's inbox.
- Track key sales activities daily. Calls, emails, and stage changes are the leading indicators that predict next month's revenue growth.
- Review pipeline coverage every week. A thin sales pipeline this week is a missed quota next month.
- Forecast future sales monthly. Sales forecasting turns raw pipeline into a number finance can actually plan around.
- Close the monitoring gap with 1:1s. Monitoring data only helps if someone acts on it within the week; sales monitoring helps most when it triggers a conversation, not just a chart.
Many teams add automation and AI scoring on top of this baseline. That is worth doing carefully, in the same way we cover the benefits and risks of innovation for any new sales tool before it touches quota data.
As sales channels multiply across marketplaces, partners, and direct reps, keeping one clean view of overall sales gets harder. It echoes what we describe in reintermediation, where new middle layers reshape how supply reaches the customer.
Sales Monitoring and the Bigger Financial Picture
Sales performance does not exist in isolation, and it ties directly into overall business performance. A factory that keeps building at the old pace while sales performance slows risks classic overproduction, unsold stock piling up because production never got the signal to slow down.
Unsold inventory and idle equipment also feed into depreciation, the accounting concept that spreads an asset's cost over its useful life. The depreciation meaning is straightforward: value declines whether or not the asset is being used, so a slower sales team quietly makes underused equipment more expensive to own. That is the depreciation definition finance teams apply every quarter.
On the upside, rising sales volume can unlock economies of scale, the drop in cost per unit that comes from producing and selling more. The economies of scale definition matters here because a sales monitoring system that keeps volume climbing steadily is often what makes those savings possible in the first place.
How Sales Monitoring Connects to Cash Flow and the Balance Sheet
A closed deal is not cash yet. It becomes accounts receivable, money owed but not collected, so the plain accounts receivable meaning is an unpaid invoice sitting on the books.
The accounts receivable definition matters to a sales leader because a slow-paying customer can wreck cash flow even while the sales dashboard looks great. Monitoring sales without watching collections is only half the picture, and that is what effective sales monitoring adds back in.
That invoice sits as an asset on the balance sheet until it is paid. The balance sheet definition is simple: a snapshot of what a company owns and owes on a given date, and the balance sheet meaning only clicks once you see receivables move across it.
Working capital, covered by the working capital definition of current assets minus current liabilities, depends heavily on how fast sales convert into paid invoices. A basic cash flow definition covers the rest: money in versus money out, timed correctly.
Gross margin closes the loop. The gross margin definition, revenue minus cost of goods sold as a percentage, and the everyday gross margin meaning both point to the same risk: a team hitting every quota can still shrink margin if bigger deals close at heavier discounts.
Related guides
Monitoring Sales: FAQ
How do you monitor your sales?
You track sales performance by centralizing pipeline and activity data in one CRM, checking a dashboard against quota daily or weekly, and reviewing metrics like conversion rate and pipeline coverage instead of waiting for the closed revenue number.
What is the 30-60-90 rule in sales?
The 30-60-90 rule is a ramp plan for new reps: the first 30 days focus on learning the product and process, the next 30 on running real sales activities with support, and the final 30 on hitting a full quota independently.
What are the 7 stages of sales?
The seven stages of sales are prospecting, preparation, approach, presentation, handling objections, closing, and follow-up. Monitoring sales performance at each stage shows exactly where deals stall in the sales cycle.
What is the 2-2-2 rule in sales?
The 2-2-2 rule is a follow-up cadence: contact a prospect 2 days, 2 weeks, and 2 months after the first touch. It keeps leads warm without turning outreach into constant messaging.
What is an example of a balance sheet?
A basic balance sheet example lists assets like cash and accounts receivable on one side, and liabilities like loans and accounts payable on the other, with the difference shown as owner's equity.
What is accounts receivable?
Accounts receivable is money customers owe a business for goods or services already delivered but not yet paid for. It sits on the balance sheet as an asset until the invoice is collected.
What is working capital?
Working capital is current assets minus current liabilities, the cash a business has on hand to cover short-term obligations like payroll, inventory, and supplier invoices.
What does a profit and loss statement look like?
A profit and loss statement example lists revenue at the top, subtracts cost of goods sold and operating expenses, and ends with net profit or loss for the period, usually a month, quarter, or year.
What is gross margin?
Gross margin is revenue minus the cost of goods sold, shown as a percentage of revenue. It measures how much a company keeps from each sale before covering overhead like rent, salaries, and marketing.
Monitoring sales is not about watching one metric harder. It is about connecting rep activity, pipeline coverage, and quota attainment to the cash flow and margin those deals eventually produce, so nothing important gets discovered a month too late.