Business Concepts
What Is Horizontal Analysis? Formula + Examples (2026)
What is horizontal analysis? Learn the formula, real examples, and how to spot cost trends before they quietly wreck your margin. See how it works step by step.

If you have ever stared at two years of financial statements and wondered what actually changed, that is the exact gap horizontal analysis fills. What is horizontal analysis? It is the practice of comparing line items across multiple reporting periods to see how revenue, costs, and profit move over time, in both dollars and percentages.
Quick answer
Horizontal analysis compares the same financial statement line item across two or more periods, showing the change as a dollar amount and a percentage. It turns a static balance sheet or income statement into a trend you can act on, like a 14% jump in operating costs that quietly eroded your margin.
Key takeaways
- Horizontal analysis tracks change across time; vertical analysis tracks proportion within a single period.
- The core formula is ((current period minus base period) / base period) x 100.
- It works on the income statement, balance sheet, and cash flow statement.
- The real value is spotting trends early, not the math itself.
- Pair it with other techniques like break even analysis to turn trends into decisions.
What Is Horizontal Analysis, Exactly?
Horizontal analysis, sometimes called trend analysis, lines up the same account across periods and asks one question: did this go up or down, and by how much? You read it left to right across the page, which is where the name comes from.
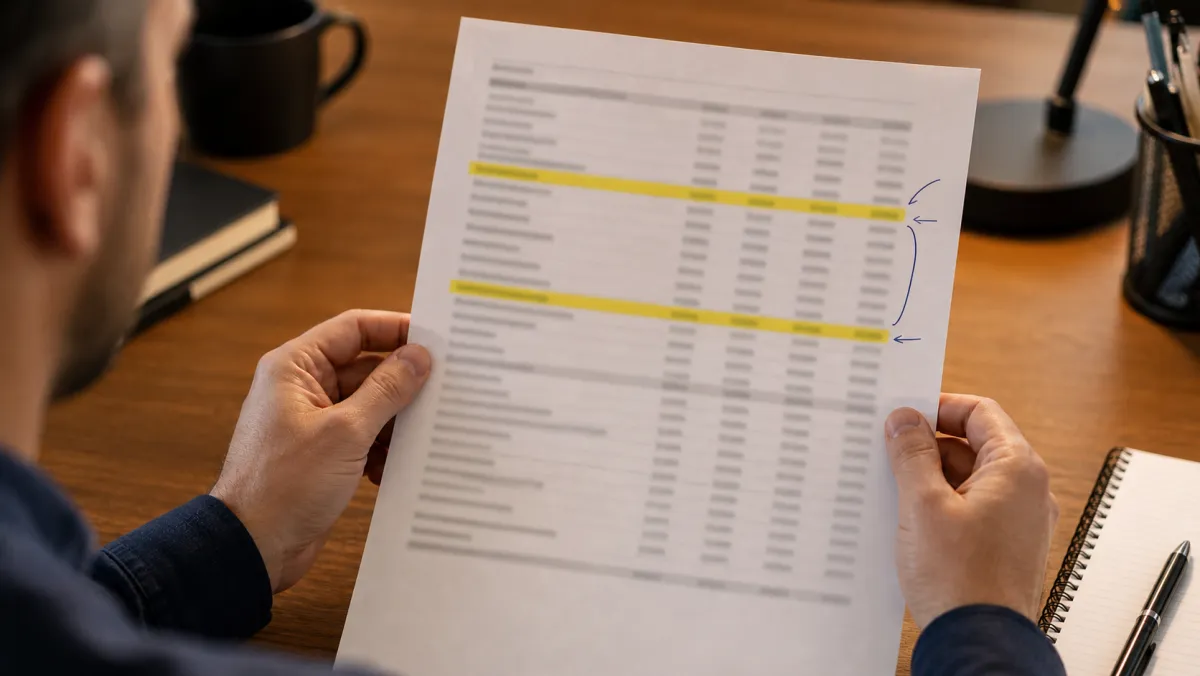
Say your revenue was $500,000 last year and $575,000 this year. Horizontal analysis reports that as a $75,000 increase, or 15%. The percentage matters more than the raw number, because it lets you compare a small line against a large one fairly.
Contrast this with vertical analysis, which expresses every line as a percentage of a base figure within one period, like each cost as a share of total sales. It sits among the core business concepts every operator should master, where horizontal is about movement over time and vertical is about structure at one moment.
What Is Horizontal Analysis Explained: The Formula
The math is deliberately simple, which is part of why it scales so well across teams. You only need two numbers: the value in the period you care about and the value in your baseline period.
The formula is:
((Current period - Base period) / Base period) x 100 = % change
Pick your base period first. Most analysts use the earliest year in the comparison as the anchor, then measure every later year against it. This keeps the trend honest instead of resetting the baseline each year.
The formula takes ten seconds. Reading the story behind a 22% cost spike is the actual job.
What Is Horizontal Analysis Examples
Numbers make this concrete. Below is a stripped-down income statement comparison across two years, the kind you would build in any spreadsheet in minutes.
| Line item | Year 1 | Year 2 | $ Change | % Change |
|---|---|---|---|---|
| Revenue | $500,000 | $575,000 | +$75,000 | +15% |
| Cost of goods sold | $300,000 | $366,000 | +$66,000 | +22% |
| Gross profit | $200,000 | $209,000 | +$9,000 | +4.5% |
| Operating expenses | $120,000 | $130,000 | +$10,000 | +8.3% |
| Net income | $80,000 | $79,000 | -$1,000 | -1.3% |
Revenue grew 15%, which looks great at a glance. But cost of goods sold grew 22%, faster than sales, so net income actually slipped. That single insight is the whole point of the exercise.

You can run the same comparison on the balance sheet to watch accounts receivable, inventory, or debt balloon over time, and on the cash flow statement to see operating cash trends that the income statement hides.
How to Apply Horizontal Analysis Step by Step
The process is repeatable once you have done it once. Treat the break even analysis step by step mindset as a model: a short, deliberate checklist rather than a one-off chore.
- Choose your statements. Grab at least two periods of the same statement, formatted identically.
- Set the base period. Usually the earliest year, kept fixed for every comparison.
- Calculate dollar change. Current period minus base period, line by line.
- Calculate percentage change. Divide the dollar change by the base period, then multiply by 100.
- Read the story. Flag any line moving faster than revenue, in either direction.
Among horizontal analysis best practices, the one operators skip most is consistency. If you reclassify an expense between years, the percentage change becomes noise. Lock your chart of accounts before you compare.
Horizontal Analysis in the Workplace and Related Techniques
In practice, finance teams rarely use horizontal analysis alone. They pair it with vertical analysis, ratio analysis, and forecasting to build a full picture. These analysis skills compound: trend data feeds your projections, which feed your budgets.
One technique that sits naturally alongside it is break even analysis. The break even analysis definition is the calculation of the sales volume at which total revenue equals total costs, so you make neither profit nor loss. Put simply, the break even analysis meaning is the point where your business stops bleeding cash on a product or line.
The benefits of break even analysis are direct: it tells you the minimum sales you need before pricing, hiring, or launching. The main types of break even analysis are unit-based (how many items you must sell) and revenue-based (how much money you must bring in). Both rely on splitting fixed and variable costs cleanly.
Common break even analysis mistakes include treating variable costs as fixed and ignoring how price changes shift the break even point. Sound break even analysis techniques keep those costs current and rerun the numbers whenever inputs move, which mirrors the same discipline horizontal analysis demands.
The clearest break even analysis best practices are to separate fixed from variable costs before you start, refresh the model whenever pricing or supplier rates change, and tie every result back to a real decision. That last habit is where the strongest break even analysis skills show up, much like spotting early warning signs at work before they snowball.
If horizontal analysis shows costs rising 22% a year, your break even point is climbing too. Used this way, break even analysis in the workplace becomes a shared language between finance and operations rather than a spreadsheet nobody reads.
Strong break even analysis strategies turn raw statements into a decision tool. Weighing the trade-offs is its own discipline, the same way you weigh the benefits and risks of innovation before committing budget to a new launch.
What Horizontal Analysis Cannot Tell You
It flags what changed, never why. A 30% revenue jump could be a price increase, a one-time deal, or a new market, and the percentages look identical. Horizontal analysis is the smoke alarm, not the investigation.
It can also mislead with tiny base numbers. A line that went from $100 to $400 shows a 300% spike that means almost nothing at scale. Always read the dollar change next to the percentage.
For a deeper grounding in the underlying method, the overview of financial statement analysis covers how these techniques fit together in formal accounting.
What Is Horizontal Analysis: FAQ
What is accounts receivable?
Accounts receivable is the money customers owe your business for goods or services already delivered but not yet paid for. It sits on the balance sheet as a current asset, and horizontal analysis often tracks it across periods to catch slow-paying customers early.
What is working capital?
Working capital is current assets minus current liabilities, the short-term cash cushion that keeps daily operations running. A shrinking working capital trend in horizontal analysis is an early warning of liquidity strain.
What is gross margin?
Gross margin is revenue minus cost of goods sold, expressed as a percentage of revenue. It shows how much of each sales dollar survives production costs, and it is one of the first lines analysts run horizontal analysis on.
What is a profit and loss statement?
A profit and loss statement, also called an income statement, summarizes revenue, costs, and profit over a period. It is the most common starting point for horizontal analysis because every line has a clear period-over-period story.
What is cash flow?
Cash flow is the net movement of money into and out of your business across operating, investing, and financing activities. Horizontal analysis of the cash flow statement reveals whether your reported profit is actually converting into cash.