Leadership
What the Buffett Indicator Signals About Stock Valuations
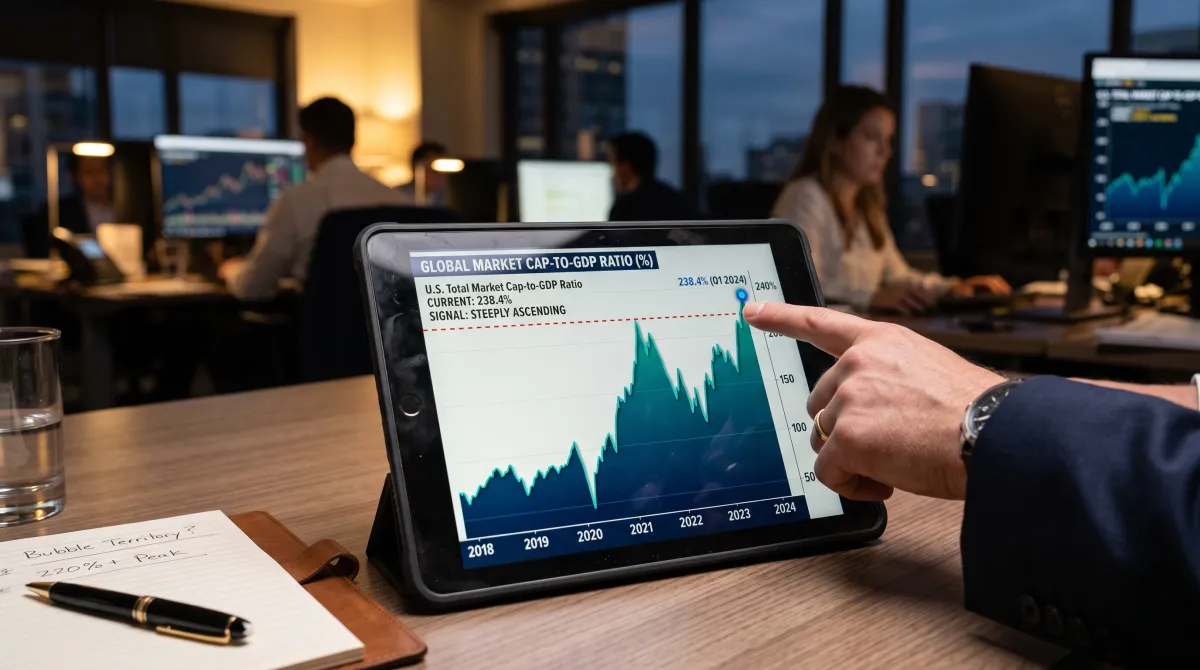
The Buffett Indicator sits near record highs at ~220-236% in 2026, flashing a strongly overvalued market. Here is what Warren Buffett's gauge means for you.

The clearest warren buffett stock market warning right now is not a speech, it is a chart. The Buffett Indicator, his favorite valuation gauge, sits near record highs while Berkshire Hathaway hoards a record pile of cash. When the market's most patient investor stops buying, it is worth understanding why.
Quick answer
The Buffett Indicator divides the total value of the U.S. stock market by the country's GDP. As of mid-2026 it reads roughly 220% to 236% depending on the source, about two standard deviations above its long-term trend and near an all-time high. That signals a strongly overvalued market. It is a long-term valuation gauge, not a timing tool, so high readings can persist for years before any correction.
Disclaimer: This article is general information, not financial or investment advice. Consult a licensed financial advisor before making decisions about money, credit or investments.
Key takeaways
- The Buffett Indicator = total U.S. market cap divided by GDP.
- Current readings of ~220-236% are near record highs and flag a strongly overvalued market.
- Buffett called it "probably the best single measure" in 2001, then warned against leaning on any one metric.
- It sets return expectations, it does not predict a crash date.
- Berkshire's record ~$397B cash pile and multi-year net selling reinforce the caution.
What the Buffett Indicator actually measures
The math is simple. Take the total market capitalization of all publicly traded U.S. stocks and divide it by U.S. gross domestic product. The result is a ratio that compares what investors pay for companies against what the economy actually produces.
Warren Buffett popularized it in a 2001 Fortune interview, calling it "probably the best single measure of where valuations stand at any given moment." The logic is intuitive: over time, stock prices cannot outrun the economy that feeds them forever. This ratio sits among the core business concepts every operator should understand.
Buffett's original comfort zone was modest. A range of 75% to 90% looked reasonable, and anything over 120% suggested the market was getting expensive. By those numbers, today's readings are off the map.
Where the gauge stands in 2026
The exact figure depends on which data source you trust, but every version tells the same story. The market is priced for near-perfection.
| Source | Reading | Verdict |
|---|---|---|
| Current Market Valuation | ~219% (Mar 31, 2026) | Strongly overvalued, ~2.1 std dev high |
| GuruFocus (TMC/GDP) | ~231.8% (Jul 3, 2026) | Implies ~-0.9% annual return |
| Advisor Perspectives | ~229.7% (Q1 2026) | Second-highest reading in history |
| MacroMicro | ~236.3% (Jun 30, 2026) | Near record high |
Put that in context. The indicator peaked near 146% before the 2000 dot-com crash and around 109% before the 2008 crisis. Today's ~220% to 236% range towers over both prior manias. We are in genuinely uncharted territory by this measure.
GuruFocus turns that level into a forecast, projecting an estimated annualized return near -0.9% including dividends over the next eight years. That is not a crash call. It is a warning that starting valuations this high leave almost no room for gains.
Why Berkshire's cash pile echoes the warning
Numbers on a chart are one thing. Watching Buffett vote with his own money is another. Berkshire Hathaway ended Q1 2026 with a record cash and Treasury bill position of about $397.4 billion, surpassing its prior peak.
That mountain of cash did not appear by accident. Berkshire has been a net seller of stocks for more than three years, offloading $24.09 billion in equities against $15.94 billion in purchases in Q1 2026 alone. The Apple stake, once nearly half the portfolio, has been trimmed to roughly 22%.
When the world's most patient buyer sits on $397 billion and cannot find anything worth owning, that silence is the loudest warning of all.
Buffett stepped down as CEO at the end of 2025, with Greg Abel now running the company. At the May 2026 annual meeting, Buffett told CNBC he "did not see the ideal investing environment." Coming from him, that understatement carries weight.

Why the indicator is not a market-timing tool
Here is the discipline most people miss. A high Buffett Indicator tells you the market is expensive. It does not tell you when the bill comes due. Overvaluation can stretch for years before it snaps.
Buffett himself was famously "early." The indicator flashed warnings in 1999 and again in 2007, yet acting purely on those signals would have meant sitting out real gains before the eventual falls. Being right about valuation and right about timing are two different skills.
There is also a structural quirk. The ratio has drifted upward over decades because U.S. companies now earn a large share of revenue overseas, which inflates market cap relative to domestic GDP. Changing GDP composition matters too, so raw levels should be de-trended before you draw firm conclusions.
That is why the smart read compares the current level to its own trend, not to a fixed line. At roughly two standard deviations above trend, even the de-trended version looks stretched. The caveats soften the signal, they do not erase it.
How to use it like an operator
Treat the indicator as a thermostat, not a fire alarm. It should shape your return expectations and your discipline, not trigger a panic sale on a single reading. Elevated valuations argue for patience and position sizing, not prediction.
Pair it with corroborating signals. Berkshire's cash, a multi-year net-selling streak, and an S&P 500 trading near 31 times trailing earnings all point the same direction. When several independent gauges agree, the message gets harder to dismiss.
The same repricing logic runs through how the 10 year treasury yield reprices every asset. When the risk-free rate rises, every future cash flow is worth less today, and rich valuations get squeezed hardest.
Then set expectations accordingly. High starting valuations historically mean lower future returns, so a decade of muted gains is a reasonable base case from here. Keep a tight one-sentence thesis you can state out loud, so you stay honest when the crowd gets loud. Overpaying is the one mistake compounding cannot fix.
Frequently asked questions
What is the Buffett Indicator?
The Buffett Indicator equals the total U.S. stock market capitalization divided by GDP. Buffett called it "probably the best single measure of where valuations stand" in a 2001 Fortune interview, though he later cautioned against relying on any single metric to judge the market.
Does a reading above 200% mean stocks are overvalued?
Yes. Readings above ~200% signal "strongly overvalued." The current ~220-236% range is roughly two standard deviations above the long-term trendline and near all-time highs, well beyond levels seen before the 2000 and 2008 downturns.
Can the Buffett Indicator predict a market crash?
No. It is a long-term valuation gauge, not a market-timing tool. High readings can persist for years before any correction. Buffett was "early" in both 1999 and 2007, when the signal appeared long before prices actually fell.
Why do experts adjust the raw Buffett Indicator?
The metric has a structural upward drift over decades, driven by globalization of corporate revenue and changing GDP composition. Because of that drift, raw levels should be de-trended before drawing conclusions, comparing today's reading to its own trend rather than a fixed threshold.
What is Berkshire Hathaway's cash pile telling us?
Berkshire held a record ~$397.4 billion in cash as of March 31, 2026, after more than three years of net equity selling. It suggests Buffett and now Greg Abel struggle to find attractively priced investments, reinforcing the overvaluation narrative rather than predicting a specific crash.
This content is for general informational purposes only and is not financial or investment advice. Consult a licensed financial professional before making financial decisions.