Leadership
SWOT Analysis Chart (2026): Build One That Drives Decisions
A SWOT analysis chart maps strengths, weaknesses, opportunities and threats in one 2x2 grid. See the four quadrants, a worked example and how to act on it.

A SWOT analysis chart is the fastest way to see where your business or project actually stands. It puts four messy questions into one clean grid, so you can stop guessing and start deciding.
Quick answer
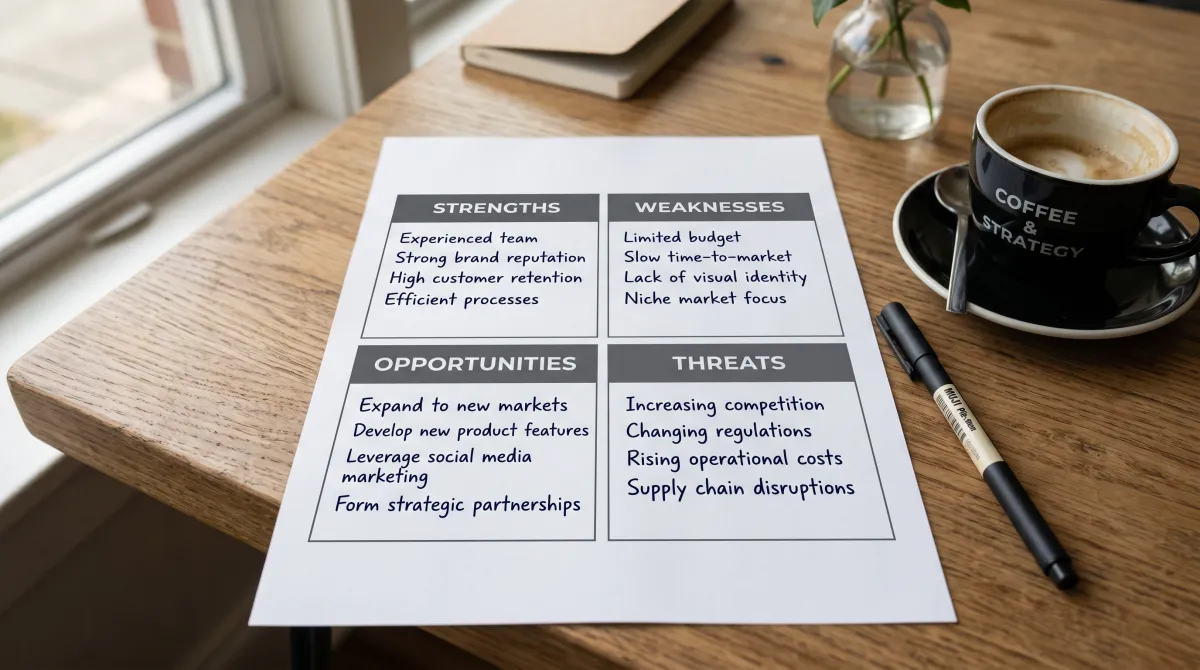
A SWOT analysis chart is a 2x2 grid that maps Strengths, Weaknesses, Opportunities and Threats. You fill the top row with internal factors you control and the bottom row with external forces you don't, then turn each quadrant into a concrete action.
Key takeaways
- The chart has four quadrants: two internal (strengths, weaknesses) and two external (opportunities, threats).
- Internal factors sit on the top row, external on the bottom, in a single 2x2 grid.
- A SWOT chart is only useful if every box ends in a decision, not a list.
- Keep each quadrant to 3-5 sharp items, not twenty vague ones.
- Pair it with a TOWS step to convert insights into moves.
What Is a SWOT Analysis Chart?
A SWOT analysis chart is a visual grid that organises four perspectives on a business, team or project. The acronym stands for Strengths, Weaknesses, Opportunities and Threats.
The top row holds internal factors you can influence directly. The bottom row holds external factors shaped by the market, competitors and conditions outside your walls.
The framework traces back to 1960s strategy research at the Stanford Research Institute, and it has stuck around because it forces clarity fast. You can read the full history of SWOT analysis on Wikipedia if you want the academic lineage.
Teams often build several swot analysis charts for different scenarios, then compare them side by side. Sitting these grids next to other strategy frameworks shows where a SWOT helps and where a different tool fits better.
The power of the grid is not the boxes themselves. It is the act of forcing internal and external factors into the same frame, where you can finally see how they collide.
The Four Quadrants Explained
Each quadrant answers a different question. Get the question right and the box fills itself.
Strengths (internal, helpful)
What do you do better than anyone in your space? Think proprietary tech, loyal customers, low costs or a brand people trust. These are advantages you already own.
Test each strength with one question: would a competitor struggle to copy it this quarter? If yes, it belongs here. If anyone could match it in a week, it is table stakes, not a strength.
Weaknesses (internal, harmful)
Where are you exposed? Thin cash reserves, a single key person, slow product cycles or weak distribution all belong here. Be honest, because this box is where most teams flinch.
A useful trick is to imagine a rival writing your weaknesses for you. The items they would attack first are the ones that matter most.
Opportunities (external, helpful)
What shifts could you ride? A new market, a competitor stumbling, changing regulation or a rising trend. Opportunities are doors, not guarantees.
Threats (external, harmful)
What could hurt you from outside? New entrants, price wars, supply shocks or shifting buyer behaviour. Naming threats early buys you time to plan.
A SWOT chart full of bullet points is a poster. A SWOT chart full of decisions is a strategy.
SWOT Analysis Chart: The Practical Guide
Building the grid is easy. Making it useful takes discipline. Here is the process I run with teams.
Step 1: Draw the 2x2 grid
Split a page or slide into four equal boxes. Label the top-left Strengths, top-right Weaknesses, bottom-left Opportunities, bottom-right Threats. Internal on top, external below.
Keep the labels consistent across every chart your team builds. When the layout never moves, anyone can read a finished grid in seconds without relearning where each factor lives.
Step 2: Fill each box with 3-5 items
Cap each quadrant at five entries. A long list feels thorough but hides the signal. Force ranking sharpens the thinking.

Step 3: Make every item specific
"Good marketing" tells you nothing. "Email list of 40k with a 32% open rate" tells you what to leverage. Specificity is what separates a working chart from wallpaper.
Where you can, attach a number, a date or a name to each entry. A vague box invites a vague debate, while a concrete one points straight at the next action.
Step 4: Convert quadrants into moves (TOWS)
Cross the quadrants to find action. Match strengths to opportunities, then use strengths to defend against threats. This step is where the chart earns its keep.
The TOWS matrix gives you four strategy types from the same data. Each pairing answers a sharper question than the raw quadrant ever could.
| Strategy type | Pairing | Question it answers |
|---|---|---|
| SO (attack) | Strengths + Opportunities | Which strengths let us seize this opening? |
| WO (build) | Weaknesses + Opportunities | Which gaps must we fix to chase this? |
| ST (defend) | Strengths + Threats | Which strengths blunt this threat? |
| WT (survive) | Weaknesses + Threats | Where are we most exposed right now? |
SWOT Chart Example: A Coffee Shop
A short example makes the grid click. Here is a SWOT for a small independent cafe, with three or four sharp items per box. Drop these entries straight into a blank 2x2 and you have a working draft in minutes.
| Quadrant | Example entries |
|---|---|
| Strengths | Prime corner location, loyal regulars, signature house blend |
| Weaknesses | Tight margins, no online ordering, one trained barista |
| Opportunities | New office tower opening nearby, growing demand for oat milk |
| Threats | Chain cafe opening two doors down, rising bean prices |
The move writes itself: use the loyal base and house blend to lock in foot traffic from the new tower before the chain opens. That single sentence is worth more than the whole grid, because it turns four boxes into one decision the owner can act on this week.
The same four boxes flex from a cafe to a SaaS startup or a non-profit. Swap the entries, keep the structure, and the chart still surfaces the one move that matters most.
Digital Tools vs Paper Charts
You can run a SWOT on a napkin, but the right tool keeps it alive. Whiteboards work for fast workshops, while a shared doc or slide keeps the chart editable as facts change.
For recurring planning, store your swot analysis charts somewhere the whole team can revisit them. A living chart that updates each quarter beats a polished one that gets filed and forgotten. Sound management practice treats the SWOT as a standing document, not a one-off slide.
Paper still wins for one thing: speed in the room. When you need ideas on the wall in five minutes, sticky notes beat any app. Capture the grid digitally afterwards so it survives past the meeting.
Common Mistakes to Avoid
Most SWOT charts fail in predictable ways. Skip these and you are ahead of most teams.
- Confusing internal and external factors, so threats land in the strengths box.
- Writing vague entries no one can act on.
- Stopping at the list instead of building the action plan.
- Doing it alone, when cross-functional input catches blind spots.
- Treating the chart as final, when markets shift every quarter.
The biggest trap is comfort. Teams love listing strengths and skim past weaknesses and threats. Flip the order and start with what could kill you, then the honest grid almost builds itself. Clear names for each of the four parts keep the boxes from blurring into one another.
When to Use a SWOT Chart
Reach for the grid before a launch, during annual planning, when evaluating a partnership or after a competitor makes a big move. It works for a startup, a department or a single project.
It also scales down to individuals. A manager planning a team restructure or an employee weighing a role change can run the same four boxes. The clearer your everyday workplace decisions, the more a quick SWOT pays off.
Once the chart surfaces priorities, drill into the highest-leverage quadrant with the right method for the decision in front of you. The grid points the way; the follow-through is where the work happens.
Related guides
FAQ
What are swot analysis charts used for?
SWOT analysis charts are used to map a company's internal strengths and weaknesses against external opportunities and threats, so teams can prioritise decisions during planning, launches or competitive shifts.
What goes in each quadrant of a SWOT chart?
Strengths and weaknesses cover internal factors you control, while opportunities and threats cover external forces in your market. Internal sits on top, external on the bottom.
How many items should each quadrant have?
Keep each quadrant to three to five specific, ranked items. Long lists dilute the signal and make the chart harder to act on.
What is the difference between a SWOT chart and a TOWS matrix?
A SWOT chart lists the four factors, while a TOWS matrix crosses them to generate strategies, such as using a strength to seize an opportunity or defend against a threat.