Business Concepts
Business Dashboard (2026): Metrics That Actually Matter
A business dashboard turns depreciation, cash flow, and gross margin into decisions you can act on this quarter. Here is how to build one that works.

A business dashboard is the one screen an operator checks before touching anything else. It pulls cash flow, gross margin, working capital, and receivables into a single view, so a leadership team spots trouble weeks before it hits the bank balance. Built well, it replaces gut feeling with numbers a team can defend in a board meeting.
Quick answer
A business dashboard is a single visual report that tracks the handful of financial and operational metrics that decide whether a business is healthy, usually cash flow, gross margin, working capital, and accounts receivable. It replaces scattered spreadsheets with live numbers a team can act on every week.
Key takeaways
- A good dashboard pairs liquidity metrics like cash flow and working capital with profitability metrics like gross margin.
- Depreciation and economies of scale explain why unit costs move even when sales stay flat.
- Overproduction is the metric most dashboards miss until inventory piles up.
- Accounts receivable and the balance sheet turn abstract accounting into a weekly decision tool.
- Reviewing the same five to eight tiles every week beats redesigning the dashboard every quarter.
What Is a Business Dashboard?
A business dashboard is a live report, usually one screen, that displays the metrics a business needs to steer itself week to week. It sits alongside the other core business concepts every operator eventually has to learn, treated as a decision tool rather than an accounting exercise.
Most founders start with a dashboard full of vanity numbers: page views, follower counts, total signups. None of those tell you if the business can pay its bills next month. A dashboard earns its place on the wall only once it tracks numbers tied directly to cash.
The metrics worth a tile fall into three buckets: liquidity, profitability, and efficiency. Liquidity asks if you can cover this month's obligations. Profitability asks if each sale actually makes money. Efficiency asks if you are producing and collecting at the right pace.
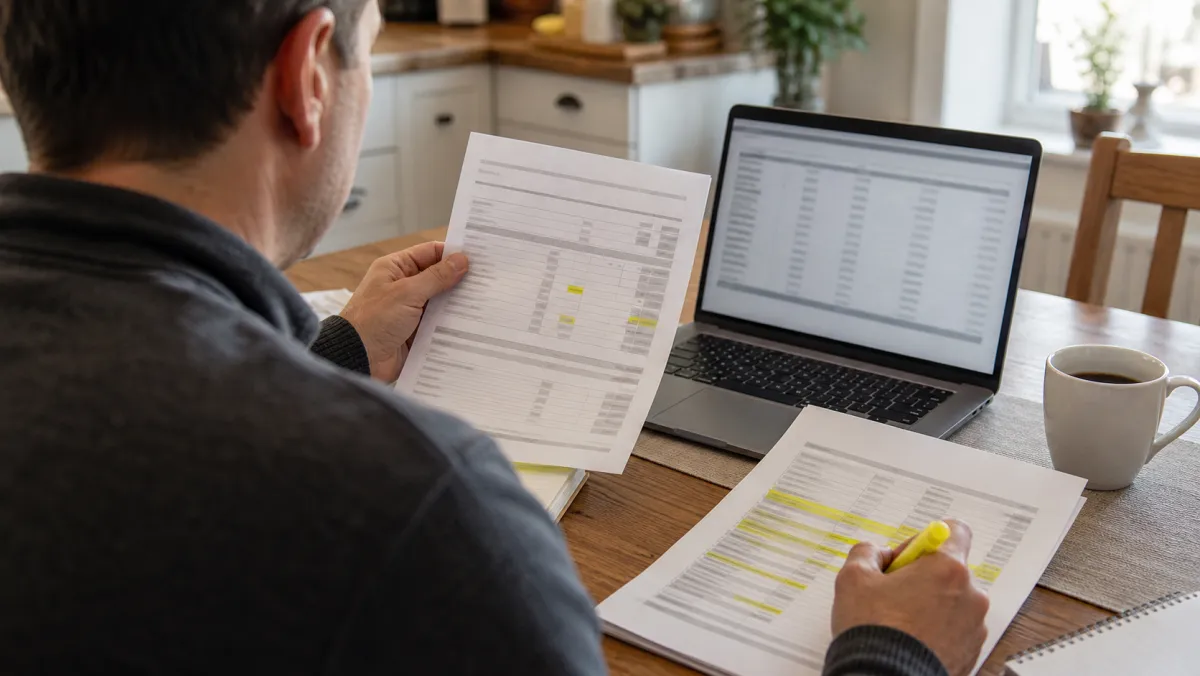
Business Dashboard Explained
Liquidity starts with the working capital definition: current assets minus current liabilities, the buffer that funds payroll and inventory between sales. A shrinking number on the dashboard means the business is quietly running out of runway, long before the bank account hits zero.
Next to it sits the cash flow definition: the actual money moving in and out of the business in a period, separate from the profit shown on paper. A company can report a profit and still run out of cash if customers pay slowly and suppliers demand payment upfront.
The accounts receivable definition matters here too: money customers owe for goods or services already delivered. The accounts receivable meaning on a dashboard is simple, it is cash already earned but not yet controlled, and it should never quietly climb month over month.
The balance sheet definition rounds out the liquidity view: a snapshot of everything the business owns and owes on one date. The balance sheet meaning for a dashboard is that it is the only report showing whether growth is funded by real equity or by debt stacking up behind the scenes. See the working capital concept for the accounting fundamentals behind these tiles.
Business Dashboard Examples
Profitability tiles start with the gross margin definition: revenue minus the direct cost of producing what you sold, shown as a percentage. The gross margin meaning changes by industry. A software company expects 70 percent or more, while a manufacturer can run healthy at 30.
Depreciation meaning belongs on the same tile. It is the gradual loss of value in equipment and machinery as it ages and gets used. The depreciation definition in accounting spreads that cost over the asset's useful life, so a factory dashboard should show it eating into margin every month, not as a surprise at year end.
Efficiency tiles bring in the economies of scale definition: the drop in per-unit cost as production volume rises. A dashboard that tracks this alongside output warns a team early when it is chasing scale that costs more than it saves. Platform businesses built through reintermediation lean hard on this tile, since their model depends on falling per-unit cost as volume climbs.
Overproduction is the metric most dashboards skip until it is too late. It happens when a business makes more than it can sell, tying up cash in inventory that depreciates or goes stale. A weekly tile comparing units produced against units sold catches this before a warehouse fills up.
| Tile | What it answers | Red flag |
|---|---|---|
| Cash flow | Do we have cash to operate this month | Negative for two periods running |
| Working capital | Can we cover short-term bills | Falling below one month of costs |
| Gross margin | Is each sale actually profitable | Dropping quarter over quarter |
| Accounts receivable | How fast do customers pay | Average collection days rising |
| Units produced vs sold | Are we overproducing | Inventory growing faster than sales |
A dashboard that only tracks revenue is a vanity mirror. A dashboard that tracks cash, margin, and receivables is a steering wheel.
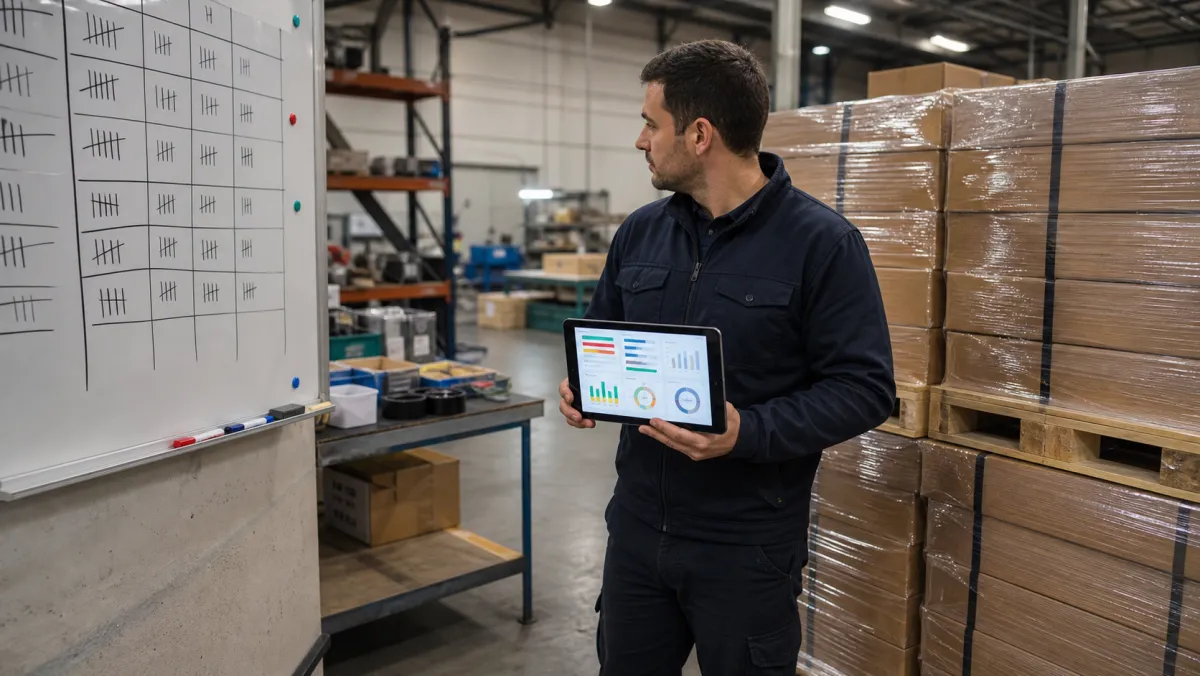
How to Apply Business Dashboard
Building one starts with picking a cadence, not a tool. Weekly works for cash flow and receivables, monthly is enough for the balance sheet and depreciation. Reviewing every tile daily just trains a team to ignore the noise.
A consistent cadence also protects the team. When numbers get hidden, delayed, or explained away meeting after meeting, that pattern often lines up with the classic signs you are being set up to fail at work, and a shared dashboard removes the excuse.
Add a tile for anything the business is betting on beyond the core: new product lines, automation, geographic expansion. That spend carries real benefits and risks of innovation, and it deserves its own line so it never quietly drags down gross margin unnoticed.
Most teams do not need dedicated software to start. A shared spreadsheet pulled from the accounting system every Monday covers the first six months. Move to a connected tool only once manual updates start eating more than thirty minutes a week.
Keep the dashboard to five or eight tiles at most. Every extra metric dilutes attention, and a team watching twenty numbers ends up acting on none of them.
Business Dashboard FAQ
What are balance sheet examples?
Balance sheet examples include a small business listing cash, inventory, and equipment as assets, then loans and unpaid bills as liabilities, with the gap between the two counted as owner equity, the cushion that absorbs a bad quarter.
What is accounts receivable?
Accounts receivable is money a business is owed by customers for goods or services already delivered but not yet paid for. It sits on the balance sheet as a current asset until the cash arrives, and a rising balance usually means collections are slipping.
What is working capital?
Working capital is current assets minus current liabilities. It measures whether a business has enough short-term resources to cover its immediate obligations without borrowing, and it is the first number lenders check before extending credit.
What do profit and loss statement examples show?
Profit and loss statement examples list revenue at the top, subtract costs and operating expenses, and end with net profit or loss for the period, showing whether the business actually made money once every bill is accounted for.
What is gross margin?
Gross margin is revenue minus the direct cost of producing what was sold, expressed as a percentage. It shows how much of every sale is left to cover overhead, salaries, and profit, and it is the fastest health check on a business model.